
- Although inventory is closer to catching up with last year, home shoppers are still contending with fewer homes for sale.
- The national inventory of active listings declined by 12.2% over last year, while the total inventory of unsold homes, including pending listings, declined by 10.7%.
- The inventory of active listings was down 60.1% compared to 2020 right at the onset of the COVID-19 pandemic. In other words, for every 5 homes available for sale in the earlier period, today there are just 2.
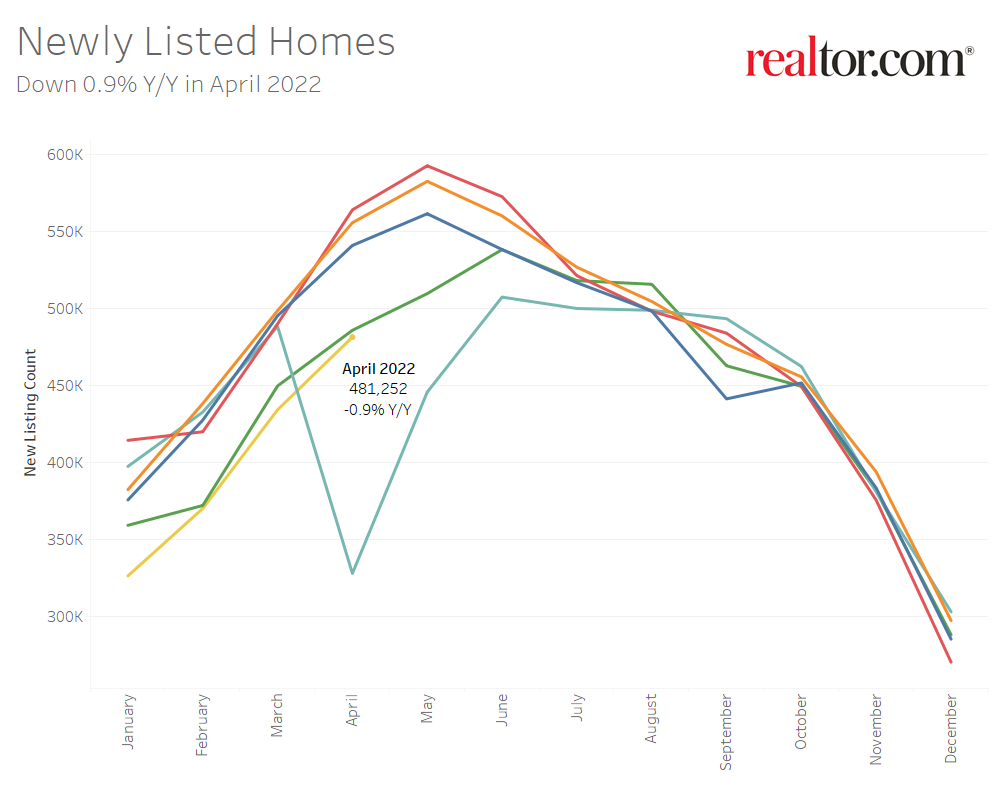
- A similar number of homeowners are listing homes for sale compared to this time last year, but the number still lags what was typical pre-pandemic.
- Newly listed homes were down 0.9% nationally compared to a year ago, and down 1.8% for large metros over the past year.
- Sellers still listed at rates 13.0% lower than typical 2017 to 2019 levels prior to the pandemic.
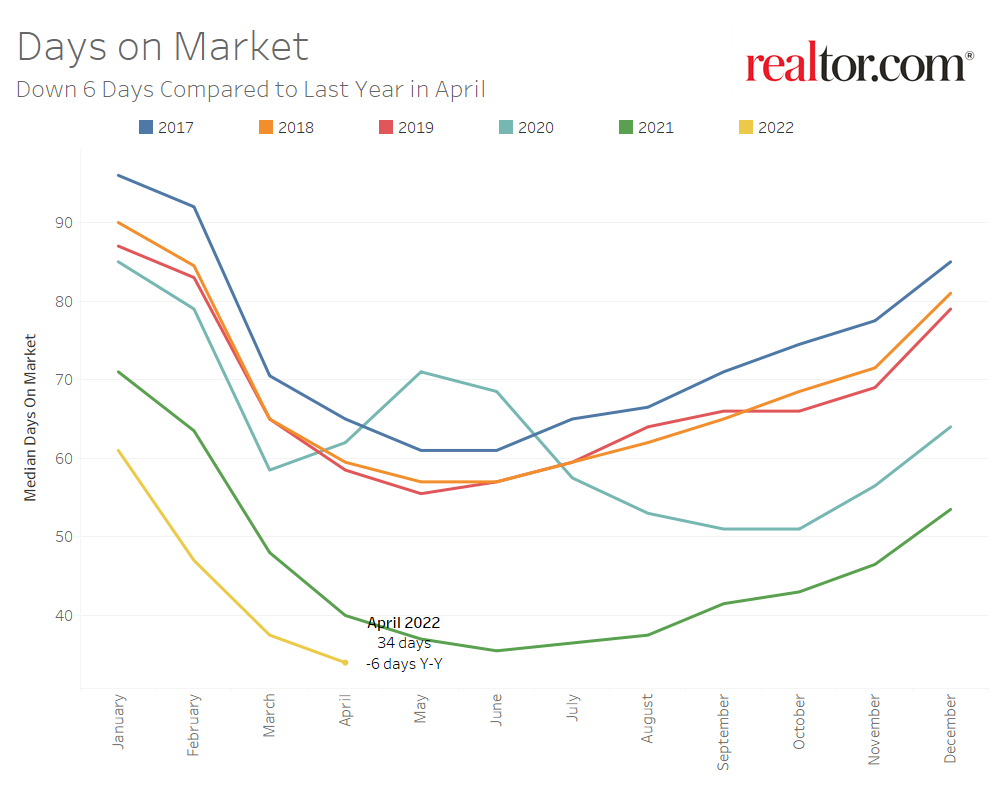
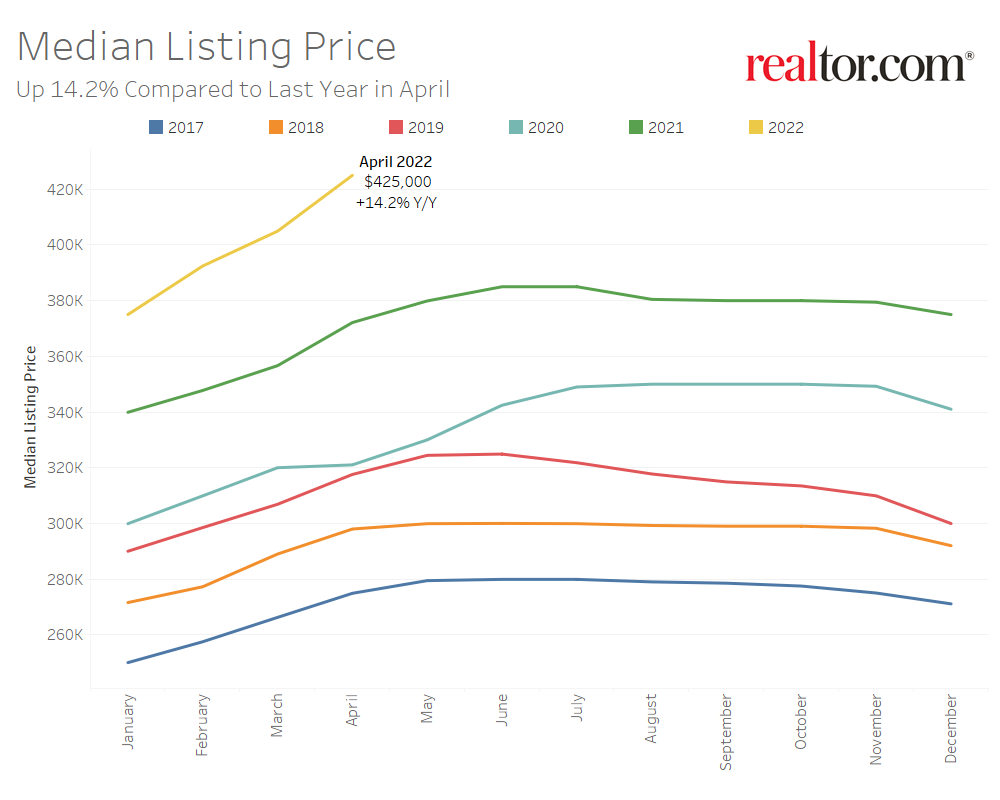
- Housing remains expensive and fast-paced with the median asking price at a new high while time on market is at a new low.
- The April national median listing price for active listings was $425,000, up 14.2% compared to last year and up 32.4% compared to April 2020.
- In large metros, median listing prices grew by 9.1% compared to last year, on average.
- Nationally, the typical home spent 34 days on the market in April, down 6 days from the same time last year and down 28 days from April 2020.
Realtor.com®’s April housing data release reveals that housing demand has continued to moderate while buyers contend with both rising home prices and rising mortgage rates. In April, the median home list price grew to a new all-time high while the number of listings in pending status–those that are in the process of being sold– declined. Sellers have also re-emerged and newly listed homes have finally increased compared to the same time last year. With inventory also projected to grow compared to last year in the coming weeks, buyers who are able to stay in the market this year may face less competition and more choice this homebuying season.
Inventory on Track to See Growth in the Coming Weeks
Nationally, the inventory of homes actively for sale on a typical day in April decreased by 12.2% over the past year, a smaller rate of decline compared to the 18.9% drop in March. This amounted to 57,000 fewer homes actively for sale on a typical day in April compared to the previous year. The total number of unsold homes nationwide—a metric that includes active listings and listings in various stages of the selling process that are not yet sold—was down 10.7% percent from April 2021. This is also a smaller rate of decline compared to last month’s 12.5% decline. In the final week of April, active listings were only down 3.4% on a year-over-year basis. If current trends persist, we may see active and total listings grow over last year in the next several weeks.

In April, newly listed homes were close to matching last year’s levels and only declined by 0.9% compared to the previous year. However, sellers were still listing at rates 13.0% lower than typical of 2017 to 2019 April levels. Nonetheless, while last month the moderation in active inventory was not a supply-driven improvement, this month, home sellers are playing a role. Sellers listed more homes than last year in 4 of the 5 weeks ending in April.
In addition to an increase in new listings, buyer demand has moderated due to the combination of rising interest rates and all-time high listing prices that have increased the cost of financing 80% of the typical home listing by almost 50% compared to a year ago. The number of pending listings on a typical day (listings that are at various stages of the selling process that are not yet sold), has declined by 9.5% compared to last April, indicating that a moderation in demand is also softening the rate of turnover in inventory. For homebuyers who are still actively searching for a home, lower competition and more seller activity will provide some relief.

The inventory of homes actively for sale in the 50 largest U.S. metros overall decreased by 10.3% over last year in April, an improvement in the rate of decline compared to last month’s 16.0% decrease. Regionally, the inventory of homes in large Northeastern metros were showing the largest year-over-year decline (-13.4%) followed by the South (-10.4%), Midwest (-7.5%), and West (-5.7%).
Inventory declined in 42 out of 50 of the largest metros compared to last year, but 8 metros saw inventory growth, up from 6 last month. Metros which saw the most inventory growth include Riverside (+23.3%), Austin (+16.5%), and Sacramento (+11.8%). Seventeen metros also saw the number of newly listed homes increase compared to last year. The markets which saw the highest year-over-year growth in newly listed homes included southern metros such as New Orleans (+15.2%), San Antonio (+12.5%), and Denver (+11.3%). Markets which are still seeing a large decline in newly listed homes compared to last year include Chicago (-15.0%), Virginia Beach (-14.8%), and Washington, D.C. (-14.1%). Large southern metros saw new listings increase by an average of 0.5% compared to last year, while northeastern metros are still seeing the fewest new listings (-5.1%) compared to last year.
Homes Spend Less Time on the Market Than Last Year, but the Gap Is Shrinking
The typical home spent 34 days on the market this April, which is 6 days less than last year and shorter than the previous low record (36 days, June 2021). Homes spent 27 fewer days on the market than typical April 2017 to 2019 timing. However, while homes are selling more quickly than last year, the gap has been shrinking as demand moderates. Last month, homes spent 11 days less on the market than the previous year. In April, the gap narrowed down to 6 days as demand for homes moderated.
In the 50 largest U.S. metros, the typical home spent 28 days on the market, and homes also spent 6 fewer days on the market, on average, compared to April 2021. Among these 50 largest metros, the time a typical property spent on the market decreased most in large metros in the South (-9 days), followed by the West (-5 days), Midwest (-4 days) and Northeast (-4 days).
Among larger metropolitan areas, homes saw the greatest yearly decline in time spent on market in the southern metros of Miami (-29 days), St. Louis (-15 days), and Raleigh (-14 days). No markets saw time on market increase compared to last year.
Price Reductions Are up but the Median List Price Reached a New High
The median national home price for active listings grew to a new all-time high of $425,000 in April. This represents an annual growth rate of 14.2%, an acceleration from last month’s growth rate of 13.5%. While high, this price growth may be lower than what individual shoppers are seeing because medians can reflect changes in the mix of what’s for sale, and today’s median reflects a larger share of smaller listings than was available one year ago. The median listing price per square foot, which is one approach to control for this change, increased by a slightly higher rate of 15.1% year-over-year in April. The median listing price for a typical 2,000 square-foot single family home, which is another metric that somewhat controls for this change, rose 17.3% compared to last year.
However, sellers are responding to a softening of demand. The share of homes having their price reduced increased from 5.6% last April to 6.9% this year, but still remains 9 percentage points below typical 2017 to 2019 levels. Forty of the largest 50 metros saw an increasing share of price reductions in April, up from 25 last month.

Active listing prices in the nation’s largest metros grew by an average of 9.5% compared to last year. Price growth in the nation’s largest metros has been lower than other areas across the country, but much of this can still be attributed to new inventory bringing relatively smaller homes to the market this year. The median listing price per square foot in the nation’s largest metros grew by 12.3% over the same period, not as high as, but closer to, the national listing price per square foot growth rate of 15.1%.
Miami (+38.3%), Las Vegas (+32.6), and Orlando (+30.7%), posted the highest year-over-year median list price growth in April. Austin homes showed the greatest growth in the share of homes with price reductions compared to last year (+6.8 percentage points), followed by Las Vegas (+5.3 percentage points) and Sacramento (+4.7 percentage points). Large western metros saw the greatest increase in the share of price reductions (+2.4 percentage points), followed by southern metros (+1.9 percentage points).
April 2022 Regional Statistics (50 Largest Metro Combined Average)
| Region | Active Listing Count YoY | New Listing Count YoY | Median Listing Price YoY | Median Listing Price Per SF YoY | Median Days on Market Y-Y | Price Reduced Share Y-Y |
| Midwest | -7.5% | -3.4% | 1.6% | 5.8% | -4 days | 0.7% |
| Northeast | -13.4% | -5.1% | 2.2% | 8.4% | -4 days | 0.0% |
| South | -10.4% | 0.5% | 14.1% | 16.8% | -9 days | 1.9% |
| West | -5.7% | -1.9% | 14.5% | 13.3% | -5 days | 2.4% |
April 2022 Housing Overview by Top 50 Largest Metros
| Metro | Median Listing Price | Median Listing Price YoY | Median Listing Price per Sq. Ft. YoY | Active Listing Count YoY | New Listing Count YoY | Median Days on Market | Median Days on Market Y-Y | Price Reduced Share | Price Reduced Share Y-Y |
| Atlanta-Sandy Springs-Roswell, Ga. | $411,000 | 8.2% | 13.3% | -10.0% | -9.1% | 31 | -4 | 8.0% | 3.0% |
| Austin-Round Rock, Texas | $625,000 | 27.6% | 27.7% | 16.5% | -7.6% | 15 | -12 | 9.4% | 6.8% |
| Baltimore-Columbia-Towson, Md. | $330,000 | -1.5% | 6.2% | -8.7% | -7.0% | 31 | -2 | 7.5% | 1.2% |
| Birmingham-Hoover, Ala. | $270,000 | -2.5% | 7.5% | -4.7% | -2.3% | 36 | -5 | 6.4% | 2.0% |
| Boston-Cambridge-Newton, Mass.-N.H. | $754,000 | 7.9% | 6.7% | -25.5% | -3.7% | 17 | -5 | 6.5% | -0.3% |
| Buffalo-Cheektowaga-Niagara Falls, N.Y. | $227,000 | -9.1% | 1.5% | -8.4% | -1.6% | 35 | -1 | 3.6% | 0.3% |
| Charlotte-Concord-Gastonia, N.C.-S.C. | $419,000 | 7.7% | 15.3% | -6.4% | 9.3% | 19 | -13 | 9.6% | 3.0% |
| Chicago-Naperville-Elgin, Ill.-Ind.-Wis. | $350,000 | 0.0% | 0.3% | -26.8% | -15.0% | 33 | -3 | 5.9% | -0.7% |
| Cincinnati, Ohio-Ky.-Ind. | $331,000 | -6.0% | 7.5% | -11.5% | 4.3% | 36 | -3 | 4.8% | 0.4% |
| Cleveland-Elyria, Ohio | $192,000 | -14.3% | 1.7% | -2.0% | 3.6% | 39 | -6 | 5.3% | -0.3% |
| Columbus, Ohio | $325,000 | 6.6% | 11.8% | -4.6% | -0.3% | 14 | -2 | 5.9% | 0.1% |
| Dallas-Fort Worth-Arlington, Texas | $438,000 | 17.1% | 19.2% | -6.9% | 5.6% | 25 | -8 | 6.5% | 2.2% |
| Denver-Aurora-Lakewood, Colo. | $675,000 | 17.4% | 8.1% | -0.3% | 11.3% | 8 | -5 | 6.3% | 2.6% |
| Detroit-Warren-Dearborn, Mich. | $248,000 | -9.8% | 2.6% | 4.9% | 0.2% | 25 | -1 | 10.7% | 3.0% |
| Hartford-West Hartford-East Hartford, Conn. | $350,000 | 15.7% | 23.2% | N/A | 0.8% | 20 | -13 | 4.2% | -1.8% |
| Houston-The Woodlands-Sugar Land, Texas | $389,000 | 11.4% | 13.5% | -10.8% | -0.2% | 37 | -6 | 8.9% | 2.0% |
| Indianapolis-Carmel-Anderson, Ind. | $300,000 | 9.2% | 15.1% | -14.4% | -7.6% | 34 | -7 | 6.2% | 0.4% |
| Jacksonville, Fla. | $419,000 | 22.9% | 22.7% | -7.3% | -5.3% | 33 | -6 | 6.1% | 1.7% |
| Kansas City, Mo.-Kan. | $386,000 | 12.2% | 14.3% | 9.0% | -3.8% | 41 | 0 | 3.9% | 0.6% |
| Las Vegas-Henderson-Paradise, Nev. | $494,000 | 32.6% | 27.5% | -4.8% | 4.9% | 22 | -6 | 12.1% | 5.3% |
| Los Angeles-Long Beach-Anaheim, Calif. | $950,000 | -3.9% | 5.3% | -21.8% | -8.1% | 29 | -5 | 6.1% | 0.9% |
| Louisville/Jefferson County, Ky.-Ind. | $290,000 | 8.8% | 11.0% | -7.8% | -12.3% | 25 | -4 | 7.3% | 1.4% |
| Memphis, Tenn.-Miss.-Ark. | $239,000 | -0.3% | 17.1% | 10.6% | 1.4% | 35 | -8 | 5.9% | 2.2% |
| Miami-Fort Lauderdale-West Palm Beach, Fla. | $578,000 | 38.3% | 25.4% | -46.6% | -8.7% | 43 | -29 | 5.2% | -0.5% |
| Milwaukee-Waukesha-West Allis, Wis. | $332,000 | 5.6% | 2.2% | -0.8% | -9.8% | 35 | -3 | 6.5% | 1.3% |
| Minneapolis-St. Paul-Bloomington, Minn.-Wis. | $414,000 | 15.1% | -2.1% | -16.5% | -3.3% | 32 | -2 | 5.0% | 1.3% |
| Nashville-Davidson–Murfreesboro–Franklin, Tenn. | $522,000 | 26.2% | 18.3% | -10.5% | 5.5% | 12 | -7 | 8.3% | 3.2% |
| New Orleans-Metairie, La. | $349,000 | 2.0% | 0.0% | -8.2% | 15.2% | 41 | -12 | 11.0% | 2.6% |
| New York-Newark-Jersey City, N.Y.-N.J.-Pa. | $712,000 | 9.6% | 30.8% | -6.4% | -1.4% | 45 | -4 | 6.9% | -0.6% |
| Oklahoma City, Okla. | $315,000 | 6.6% | 16.6% | -0.4% | N/A | 36 | -7 | 5.9% | 0.0% |
| Orlando-Kissimmee-Sanford, Fla. | $427,000 | 30.7% | 28.9% | -22.2% | 3.5% | 32 | -13 | 6.5% | 0.8% |
| Philadelphia-Camden-Wilmington, Pa.-N.J.-Del.-Md. | $323,000 | -5.0% | 5.1% | -5.8% | 1.9% | 36 | -4 | 7.9% | 1.3% |
| Phoenix-Mesa-Scottsdale, Ariz. | $527,000 | 22.0% | 22.2% | 9.8% | -4.1% | 27 | -4 | 9.2% | 3.9% |
| Pittsburgh, Pa. | $227,000 | -15.1% | -7.6% | -8.2% | -5.1% | 43 | -1 | 8.6% | 1.4% |
| Portland-Vancouver-Hillsboro, Ore.-Wash. | $585,000 | 11.2% | 13.3% | -11.2% | -1.2% | 30 | -4 | 10.7% | 1.7% |
| Providence-Warwick, R.I.-Mass. | $475,000 | 17.3% | 13.2% | -16.1% | -7.4% | 27 | -6 | 4.0% | 0.6% |
| Raleigh, N.C. | $475,000 | 17.9% | 23.7% | -34.5% | -10.9% | 9 | -14 | 5.4% | 1.8% |
| Richmond, Va. | $375,000 | 3.0% | 10.4% | -26.4% | -10.2% | 35 | -5 | 3.3% | -0.3% |
| Riverside-San Bernardino-Ontario, Calif. | $592,000 | 18.4% | 17.3% | 23.3% | 2.0% | 28 | 0 | 8.2% | 4.5% |
| Rochester, N.Y. | $200,000 | -19.9% | -4.3% | -13.6% | -8.4% | 11 | -5 | 5.7% | 0.0% |
| Sacramento–Roseville–Arden-Arcade, Calif. | $649,000 | 13.2% | 14.1% | 11.8% | -1.0% | 24 | -2 | 9.7% | 4.7% |
| San Antonio-New Braunfels, Texas | $371,000 | 18.2% | 19.7% | 11.7% | 12.5% | 36 | -5 | 6.4% | 2.1% |
| San Diego-Carlsbad, Calif. | $900,000 | 9.8% | 11.4% | -15.3% | -7.5% | 22 | -7 | 5.6% | 1.6% |
| San Francisco-Oakland-Hayward, Calif. | $1,098,000 | 4.6% | 6.3% | -4.1% | -3.0% | 24 | -6 | 5.1% | 1.3% |
| San Jose-Sunnyvale-Santa Clara, Calif. | $1,432,000 | 15.2% | 10.8% | -29.2% | -4.1% | 20 | -9 | 3.2% | -1.6% |
| Seattle-Tacoma-Bellevue, Wash. | $800,000 | 19.5% | 10.0% | -20.6% | -10.4% | 21 | -7 | 4.4% | 1.1% |
| St. Louis, Mo.-Ill. | $273,000 | 4.1% | 5.7% | -14.4% | -8.2% | 40 | -15 | 6.0% | 0.6% |
| Tampa-St. Petersburg-Clearwater, Fla. | $412,000 | 28.8% | 28.7% | -3.2% | 0.6% | 29 | -8 | 6.4% | 1.1% |
| Virginia Beach-Norfolk-Newport News, Va.-N.C. | $349,000 | 10.3% | 10.9% | -33.4% | -14.8% | 18 | -7 | 6.8% | 0.8% |
| Washington-Arlington-Alexandria, DC-Va.-Md.-W. Va. | $562,000 | 11.3% | 3.7% | -15.7% | -14.1% | 28 | -2 | 6.3% | 0.5% |
Note: Oklahoma City new listing count growth and Hartford active listing count growth are not available due to data inconsistencies.