
News Release
Gross Domestic Product by County, 2021
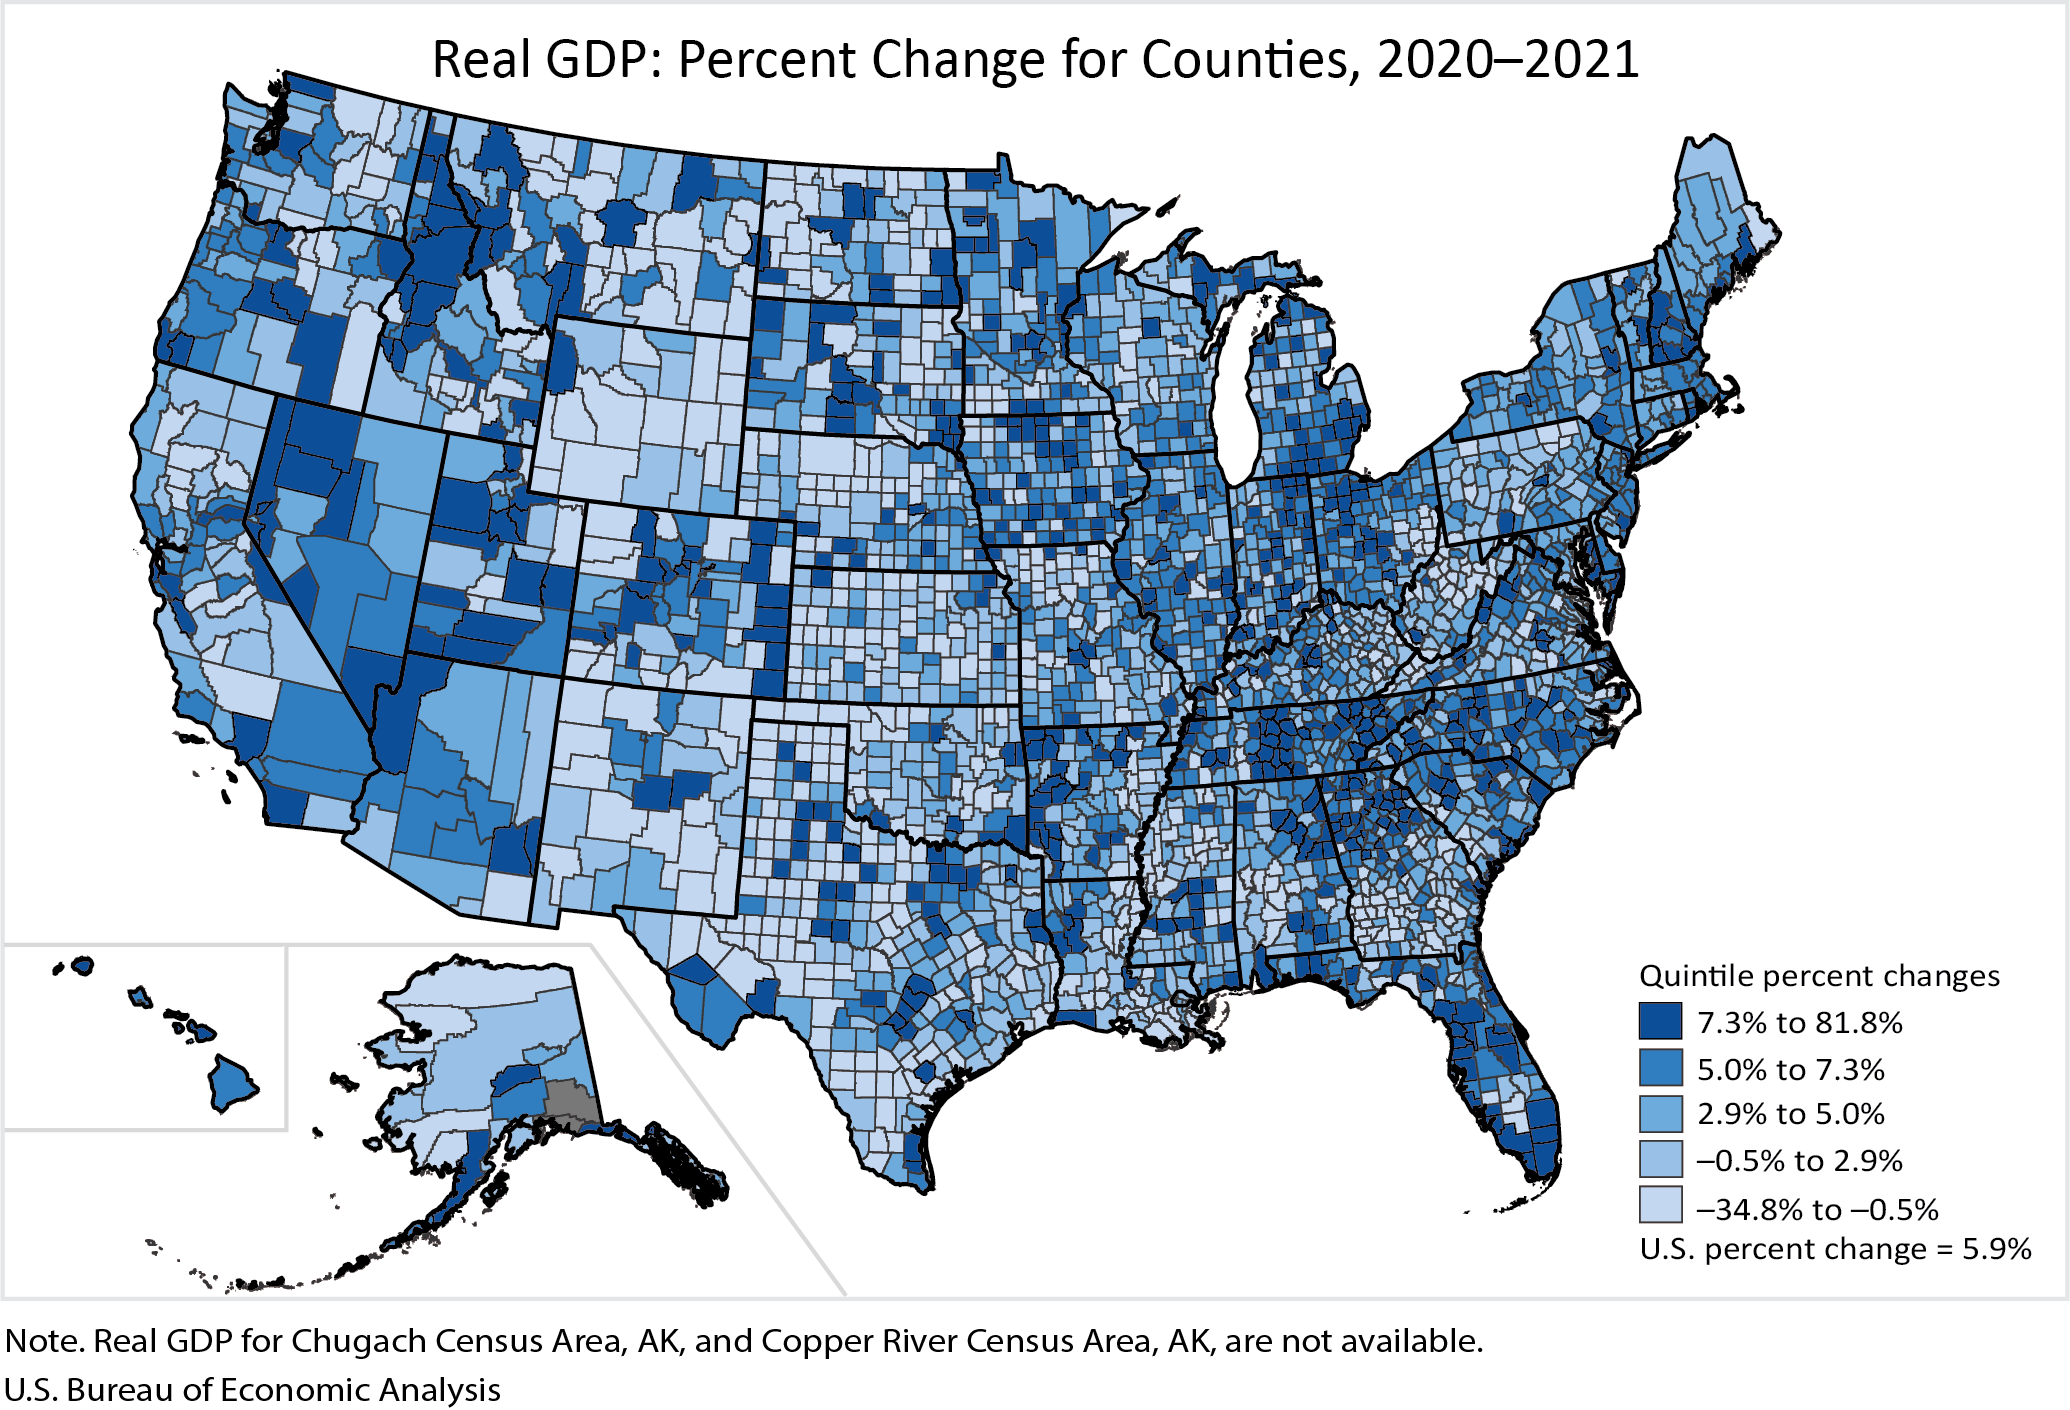
Real gross domestic product (GDP) increased in 2,404 counties, decreased in 691 counties, and was unchanged in 17 counties in 2021, according to estimates released today by the U.S. Bureau of Economic Analysis (BEA). The percent change in real GDP ranged from 81.8 percent in Coke County, TX, to –34.8 percent in Chouteau County, MT (table 1).
GDP is the value of goods and services produced within a county. The size of a county's economy as measured by GDP varies considerably across the United States. In 2021, the total level of real GDP ranged from $11.7 million in Petroleum County, MT, to $711.9 billion in Los Angeles County, CA.
Highlights
Large counties (144 counties with populations greater than 500,000 in 2021)
- Real GDP increased in 143 counties and decreased in 1 county.
- GDP ranged from $13.8 billion in Pasco County, FL, to $711.9 billion in Los Angeles County, CA.
- San Francisco County, CA, had the largest increase, at 14.0 percent. The finance and insurance industry was the leading contributor to the county's growth.
- Kern County, CA, had the only decrease, at 1.1 percent. The mining industry was the leading contributor to the decrease.
Medium counties (473 counties with populations between 100,000 and 500,000 in 2021)
- Real GDP increased in 456 counties, decreased in 15 counties, and was unchanged in 2 counties.
- GDP ranged from $2.3 billion in Bastrop County, TX, to $42.3 billion in Polk County, IA.
- Elkhart County, IN, had the largest increase, at 25.3 percent. The durable-goods manufacturing industry was the leading contributor to the county's growth.
- Weld County, CO, had the largest decrease, at 6.7 percent. The mining industry was the leading contributor to the decrease.
Small counties (2,495 counties with populations less than 100,000 in 2021)
- Real GDP increased in 1,805 counties, decreased in 675 counties, and was unchanged in 15.
- GDP ranged from $11.7 million in Petroleum County, MT, to $14.4 billion in Martin County, TX.
- Coke County, TX, had the largest increase, at 81.8 percent. The utilities industry was the leading contributor to the county's growth.
- Chouteau County, MT, had the largest decrease, at 34.8 percent. The agriculture, forestry, fishing, and hunting industry was the leading contributor to the decrease.
Annual update to county and metropolitan area GDP
The estimates for 2021 incorporate the results of BEA's annual update of GDP by county and metropolitan area that was also released today. The annual estimates of county and metropolitan area GDP for 2017 to 2020 were revised. The update incorporates revised source data that are more complete and more detailed than previously available, the results of the September 2022 annual update of the National Income and Product Accounts, the September 2022 annual update of GDP by industry, the September 2022 annual update of GDP by state, and the November 2022 annual update of personal income by county.
Next release: December 7, 2023, at 8:30 a.m., EST
Gross Domestic Product by County, 2022